A game can run at high FPS and still freeze for a fraction of a second, even on a fast PC. Sometimes the game is doing memory work that delays the next frame. The November 2026 Oxygen Not Included update gives a concrete example and suggests what to look for when a hitch keeps coming back.
What Oxygen Not Included changed
The 19 November 2026 Quality of Life update cut temporary memory allocations in overlays, side panels and other systems so garbage collection would run less often. It also enabled incremental garbage collection and made other optimisations to offset the extra overhead. The same update fixed separate leaks involving pathfinding, loading another save and loading colony images in the Load Game screen.
The patch also changed work done around saving and opening some screens for the first time. A matched before-and-after comparison can show how the update as a whole affected your colony. Measuring the effect of the collector on its own would require profiling or builds that isolate that change.
How memory work can delay a frame
In a Unity game, the garbage collector reclaims memory from managed objects the game no longer references. A full collection can pause the main CPU thread long enough to delay the next frame, even when the GPU has spare capacity. Incremental collection spreads that work across several frames to shorten the interruptions. The game still has to do the work.
At a steady 120 FPS, frames arrive roughly 8.3 ms apart. A gap of 40 ms is almost five times that interval, so a brief hitch can stand out while average FPS stays high. These timings are an example.
High FPS but Game Still Stutters? How to Fix Frame Time Spikes
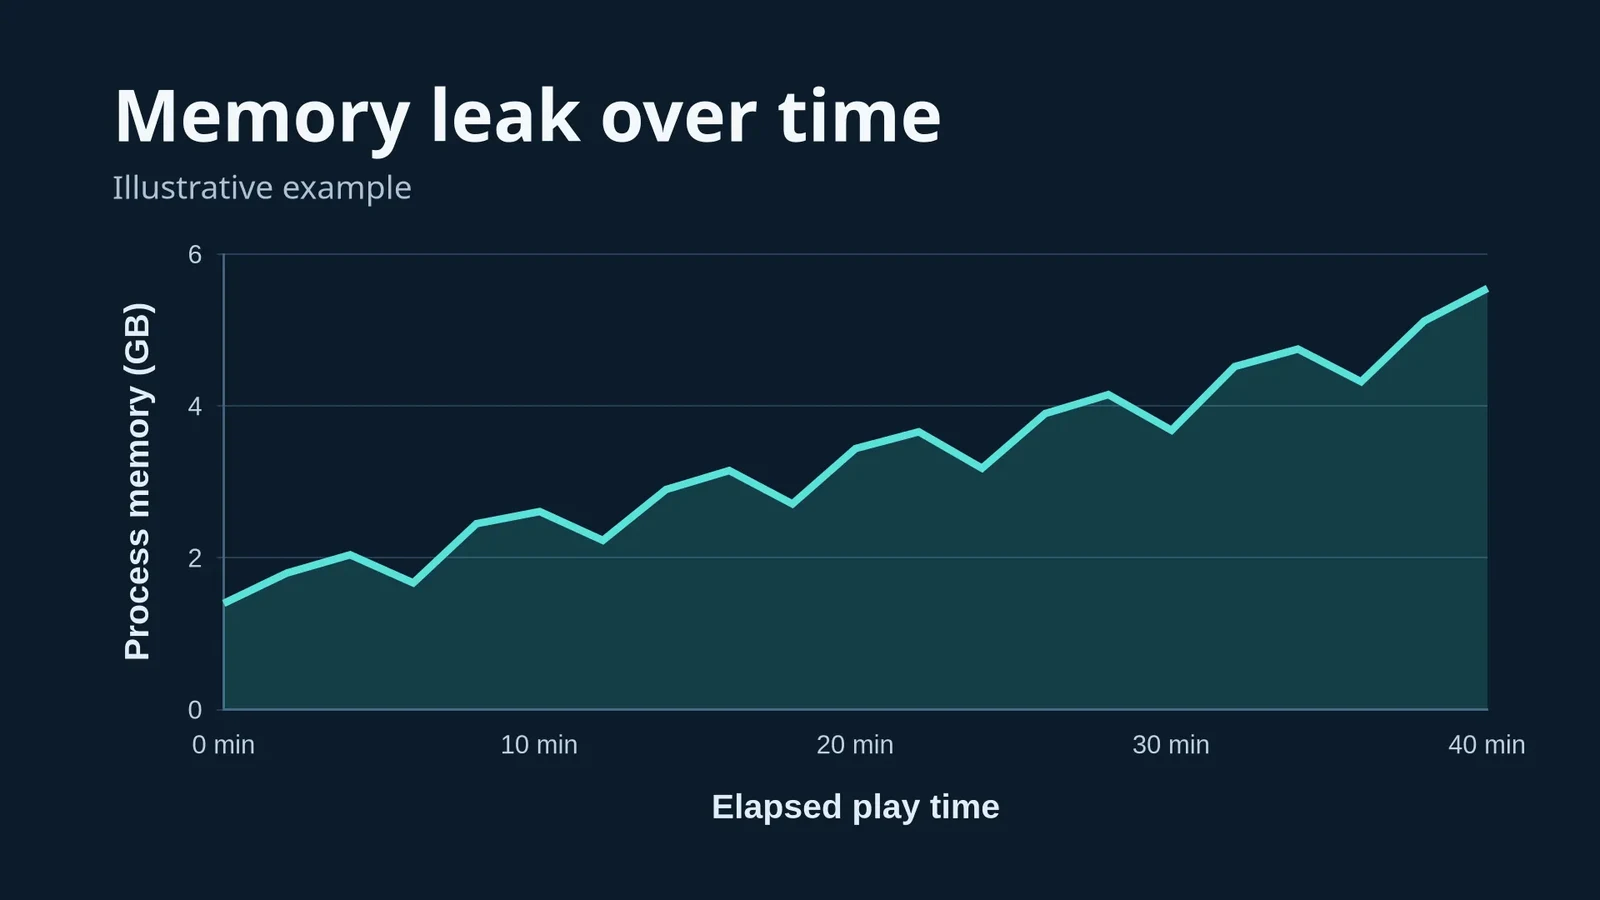
A leak occurs when the game fails to release memory it no longer needs. If the same action leaves more memory behind each time, usage can build up over a session. If that growth puts Windows under memory pressure and the system has to fetch data from storage, the extra waits can contribute to hitches. Ordinary loading and caching can also raise a game's memory use, so look at the trend across equivalent repetitions.
Windows 11 26H2 Memory Changes: What to Check on an 8GB Gaming PC
Compare the same scene early, late and after a relaunch
- Pick one repeatable scene or action. In Oxygen Not Included, start with the same manual save, camera position, zoom and simulation speed. If you suspect save-switching, repeat the same sequence between two saves. Record the game build, mods and background apps. Keep the FPS cap and graphics settings fixed for the main comparison.
- Start the game and capture a short pass after the save loads and settles. In PresentMon, target the game and capture Between Presents (MsBetweenPresents), the gap between successive frame submissions. Include GPU Busy where available. Use the same trace metric and pass length each time. Mark the time of each visible hitch or trigger.
- Open Windows Performance Monitor as administrator. Under Monitoring Tools, open Performance Monitor properties, then add Process > Private Bytes on the Data tab for the game instance. This tracks private allocations. In Task Manager under Performance > Memory, note Available and Committed. Take readings at the same points after loading in each pass.
- Keep playing until the hitch usually develops. Repeat the same pass in the existing process, then fully exit the game, relaunch it and repeat from the same save after the same warm-up. If reloading a save is part of the suspected trigger, write down each reload. Re-select the game process in your tools after relaunch.
Let the pattern guide your next test
| What you see | What to check next |
|---|---|
| One action repeatedly produces a long frame without a matching rise in GPU Busy | Check patch notes for that action and note its timing. Collection, saving and simulation can all delay a frame. Identifying the engine task takes profiling. |
| Private Bytes rises after each repeat, hitches worsen, and a relaunch restores the earlier baseline | Repeat the full comparison. If it holds, report a possible retention problem with the save, build and steps. A fresh process can reset caches as well as leaked allocations. |
| Available RAM stays low and hard faults and storage reads rise around the hitches | Repeat with one memory-heavy background app closed. Hard faults can involve file reads as well as page-file reads. Check the timing alongside the frame trace. |
| GPU Busy and long frames rise together in the same scene | Lower render scale or resolution for one matched comparison. If both fall consistently, rendering load likely contributes to the spikes. Keep the other settings and session age comparable. |
If the hitch mostly happens on the first visit to a scene or the first use of an effect, record that pass separately. When you compare later passes, give both runs the same warm-up and record any difference in prior play or cache state.
Did Your Shader Stutter Fix Work? How to Test Without Cache Bias
FAQ
Yes. A full managed-memory collection can pause the main thread even when Windows has memory to spare. The pause comes from checking which objects the game still uses.
A single high reading tells you little. Look for a baseline that keeps rising after the same workload settles on each repeat. A trace can show when memory builds up. Identifying the allocation responsible takes deeper profiling.
Lower render scale can reduce the time the GPU spends drawing the scene. Unity's collection mode is set by the game build. If GPU Busy falls and the same hitch remains, investigate the action that triggers it.
A relaunch starts a fresh game process, resetting its accumulated allocations and other session state. If the hitch returns after the same actions on the same save, record that sequence and the memory trend for the developer.