Published: 6/2/2025
🕒 4 min read
Modern Windows systems include many services, tasks, and telemetry processes that can add overhead in real-time scenarios. This deep dive shows how targeted OS-level optimization (via HD OPTI) affects latency, using LatencyMon to measure kernel responsiveness.
Why LatencyMon?
LatencyMon evaluates a system’s ability to handle real-time audio and task scheduling. It tracks interrupt & DPC behavior, peak service times, and memory faults—all of which can contribute to stutters, audio pops, and input lag. Lower latencies generally mean a smoother, more responsive experience.
Test Setup
Two Windows 11 configurations were analyzed:
- Baseline: Default Windows install (and HDOS baseline for a separate comparison)
- Optimized: Services & scheduling tuned with the HD OPTI App
Each run lasted 15 minutes under idle conditions to keep results consistent and comparable.
Key Metrics Explained
- Avg Interrupt-to-Process Latency: OS response time to hardware events (impacts input feel).
- Avg DPC Latency: Time drivers spend in deferred procedure calls—should be short and predictable.
- Max ISR/DPC Times: The longest single service durations—spikes often correlate with stutter.
- Total Time in ISRs/DPCs: CPU time spent servicing these paths.
- ISR/DPC Count: Volume of interrupts and DPCs.
- Hard Pagefaults: Memory fetches from disk instead of RAM.
Base Windows: Before vs After
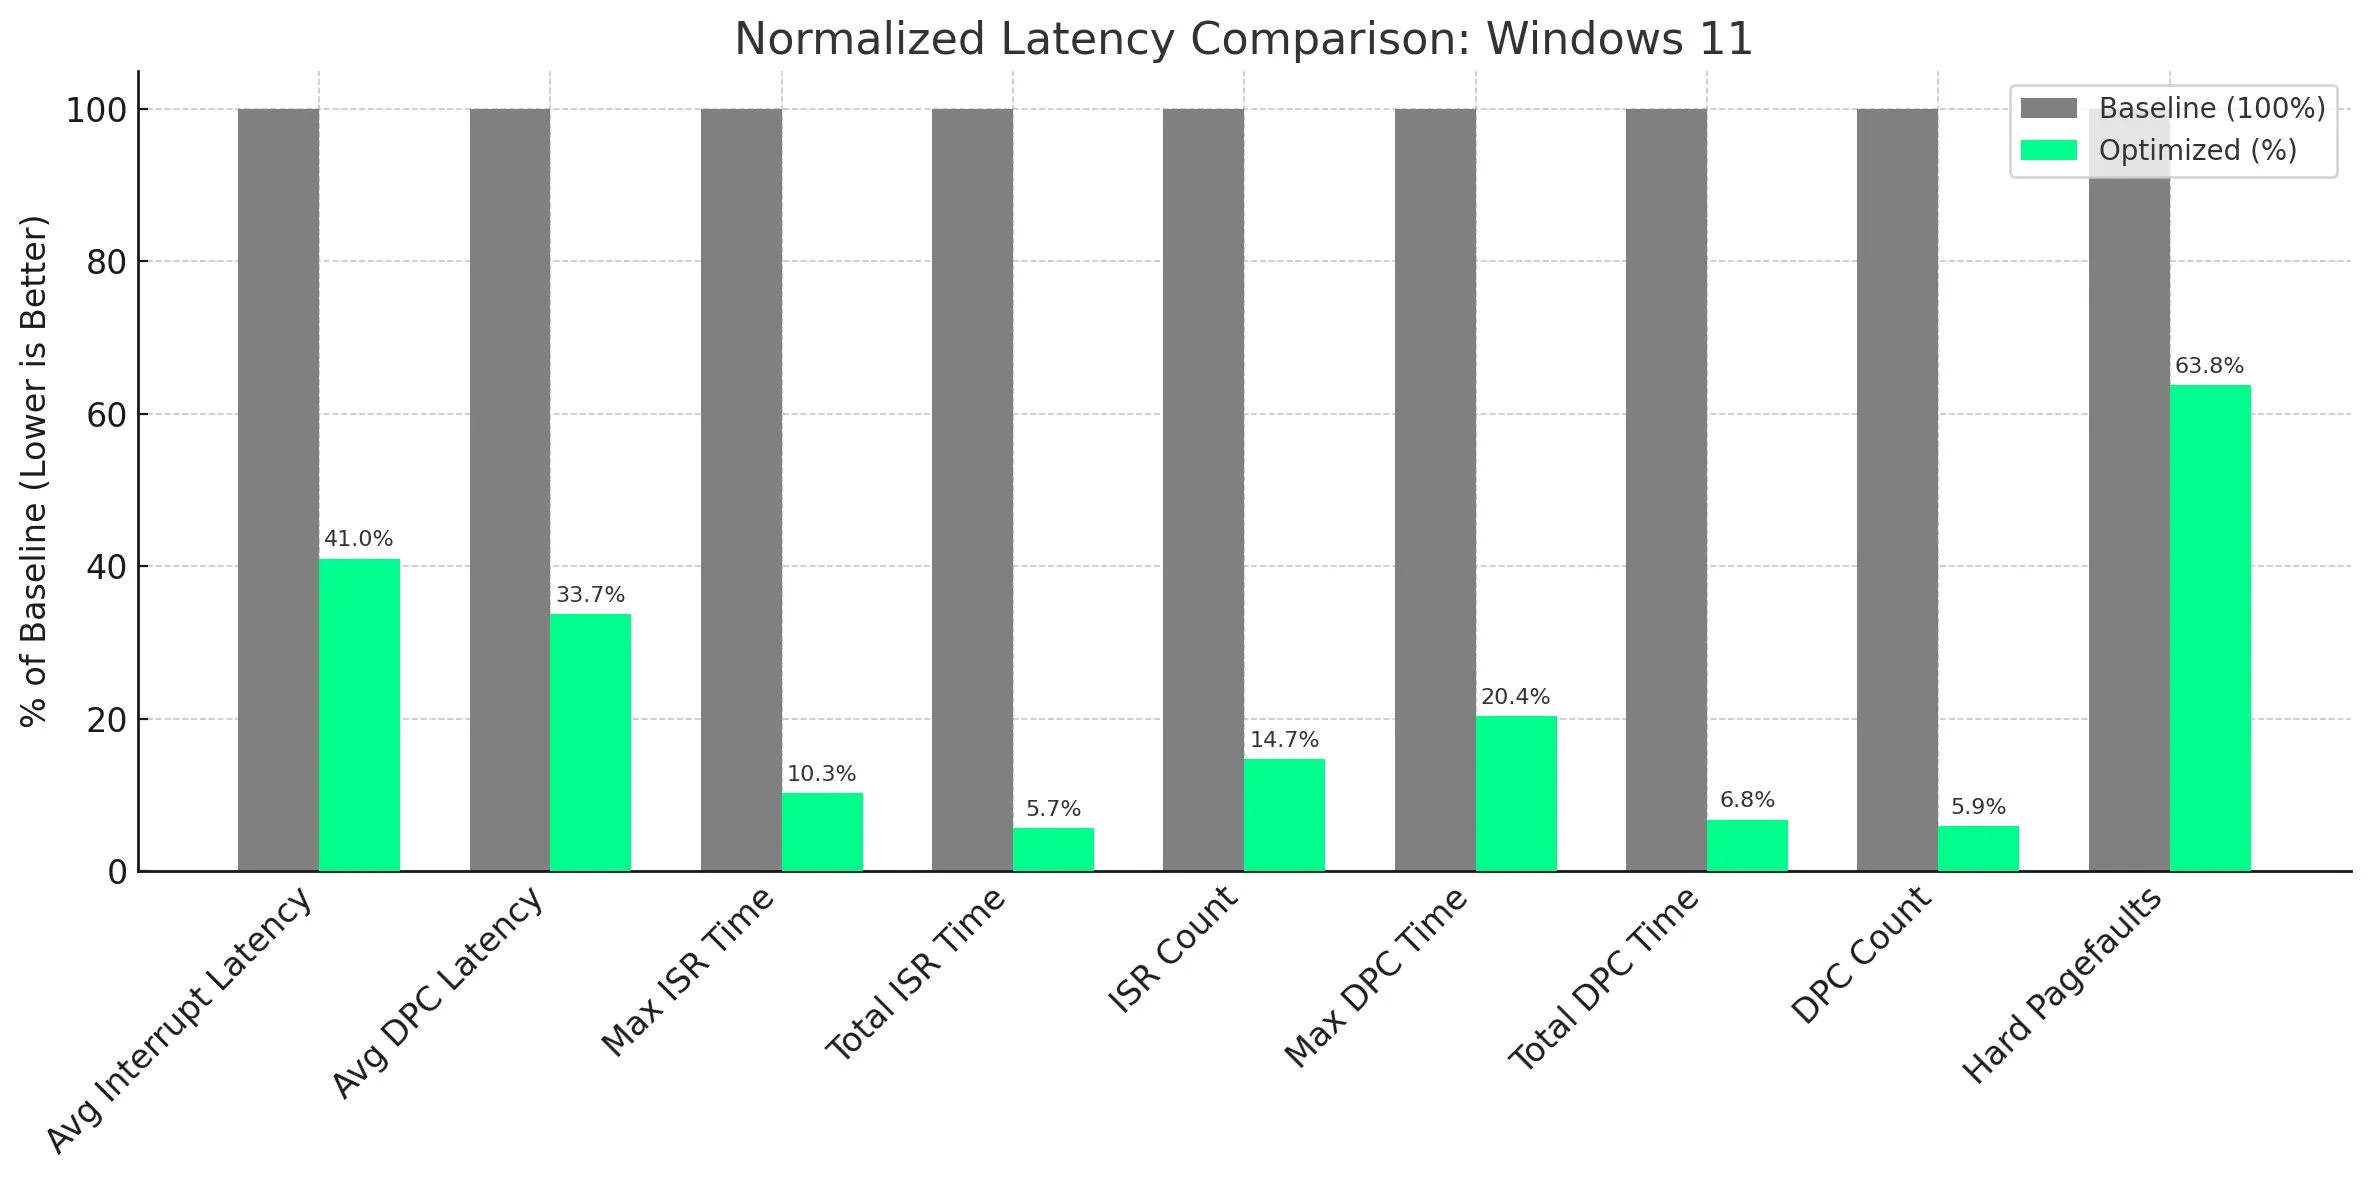
Raw LatencyMon readings (baseline vs optimized Windows 11):
| Metric | Baseline | Optimized | % Improvement |
|---|---|---|---|
| Avg Interrupt Latency (µs) | 12.48 | 5.12 | 59.0% |
| Avg DPC Latency (µs) | 2.67 | 0.90 | 66.3% |
| Max ISR Time (µs) | 63.75 | 6.55 | 89.7% |
| Total ISR Time (%) | 0.000859 | 0.000049 | 94.3% |
| ISR Count | 191,666 | 28,167 | 85.3% |
| Max DPC Time (µs) | 567.76 | 115.65 | 79.6% |
| Total DPC Time (%) | 0.02610 | 0.001767 | 93.2% |
| DPC Count | 982,730 | 58,297 | 94.1% |
| Hard Pagefaults | 5,931 | 3,782 | 36.3% |
HDOS Optimization Comparison
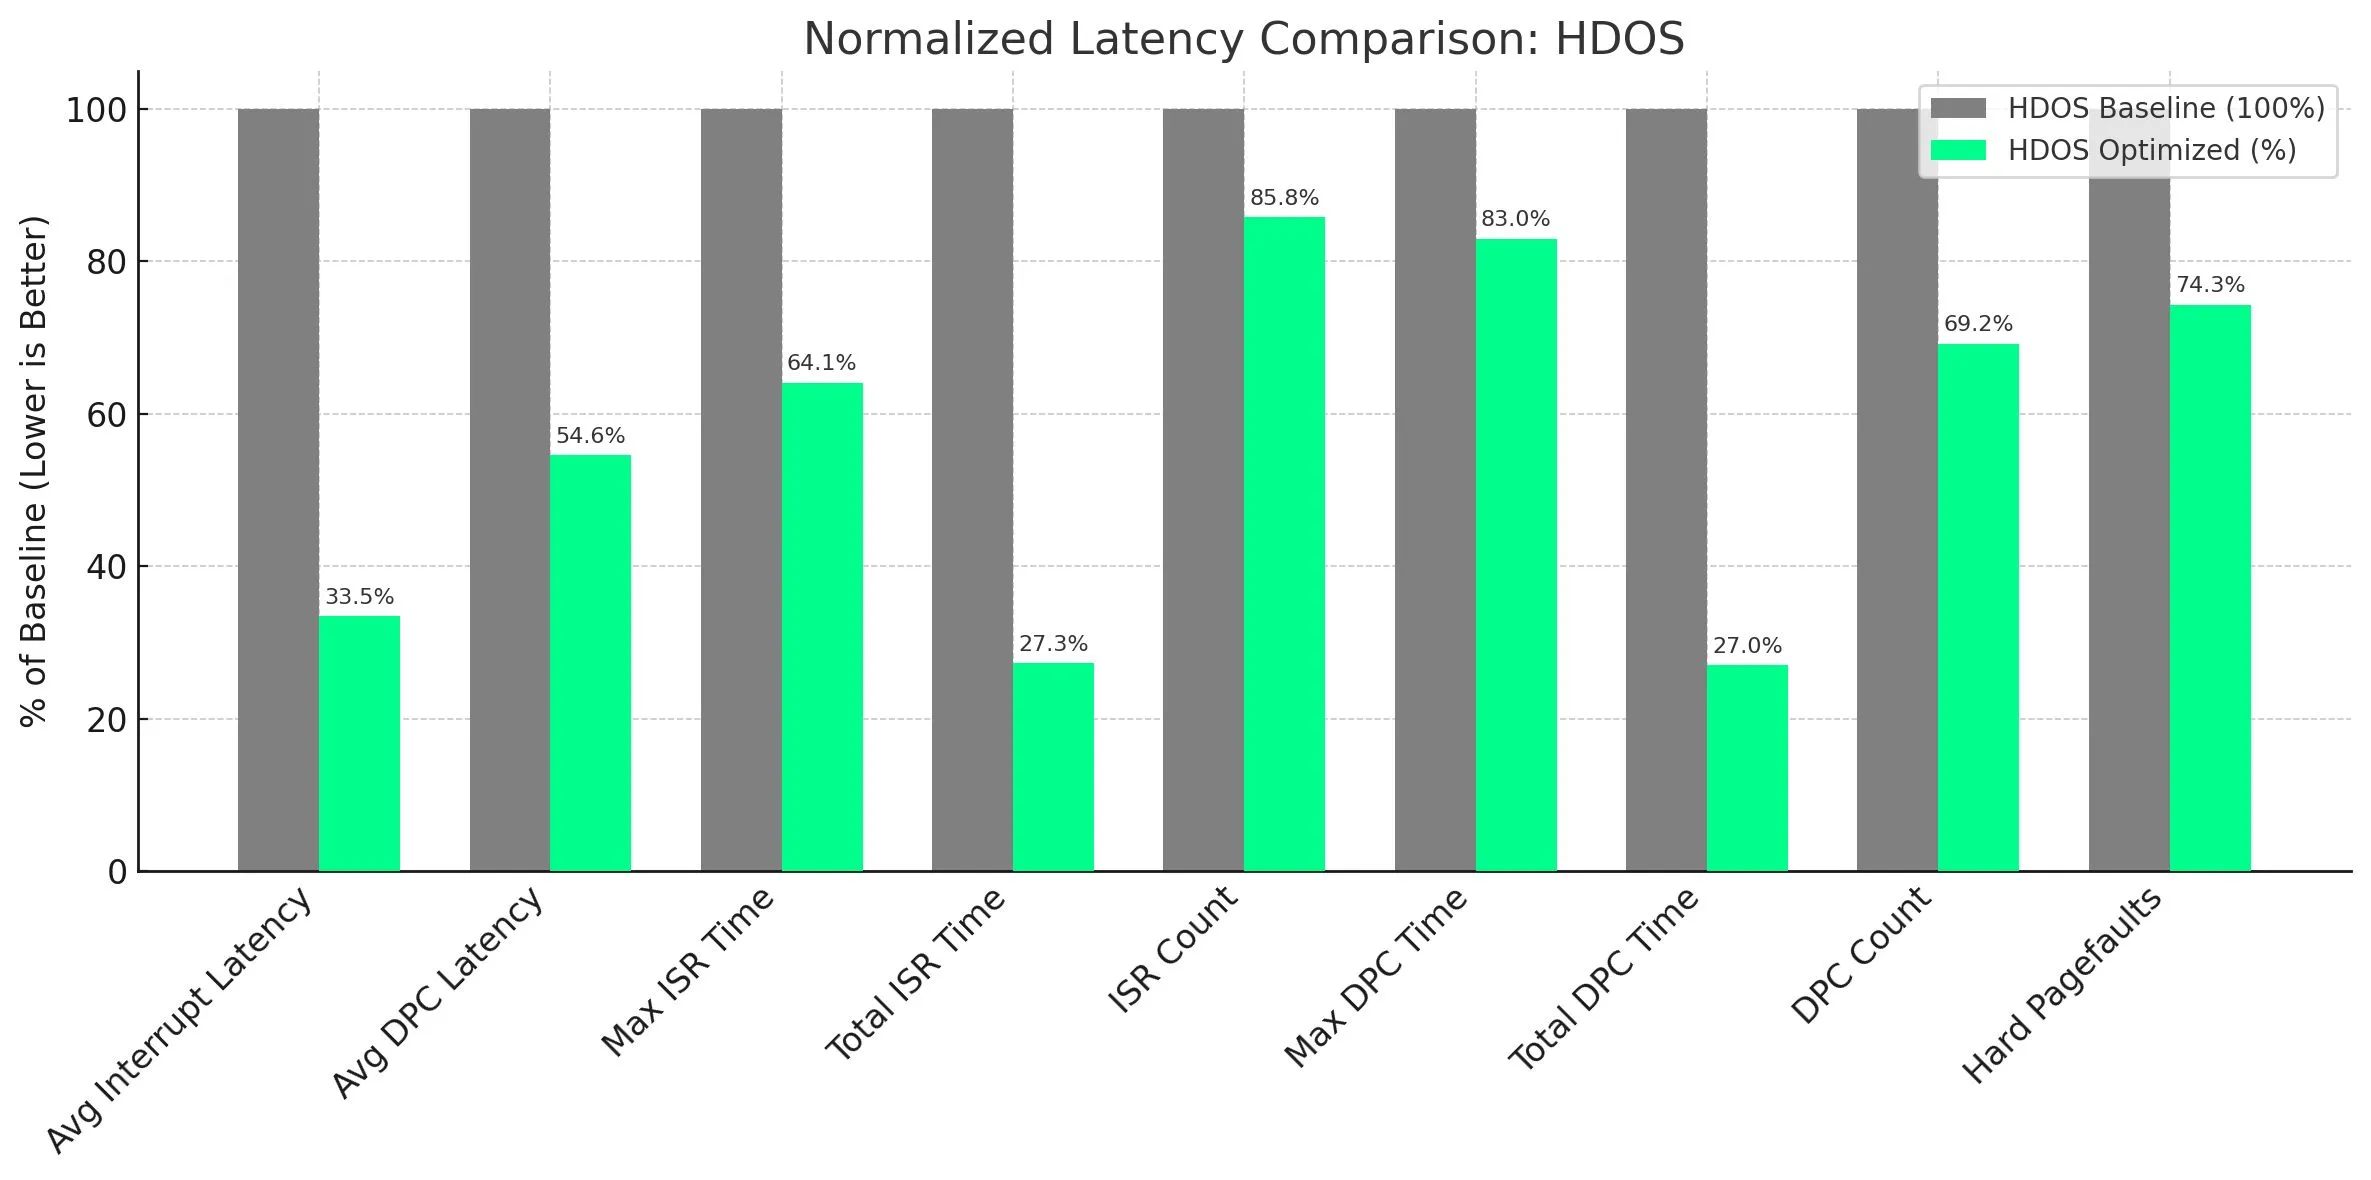
We repeated the analysis on stock HDOS and optimized HDOS to compare behavior:
| Metric | HDOS Baseline | HDOS Optimized | % Improvement |
|---|---|---|---|
| Avg Interrupt Latency (µs) | 13.81 | 4.62 | 66.5% |
| Avg DPC Latency (µs) | 1.45 | 0.79 | 45.5% |
| Max ISR Time (µs) | 29.40 | 18.84 | 35.9% |
| Total ISR Time (%) | 0.000183 | 0.000050 | 72.7% |
| ISR Count | 33,476 | 28,719 | 14.2% |
| Max DPC Time (µs) | 154.52 | 128.21 | 17.0% |
| Total DPC Time (%) | 0.006464 | 0.001748 | 73.0% |
| DPC Count | 165,571 | 114,599 | 30.8% |
| Hard Pagefaults | 13,994 | 10,397 | 25.7% |
What Was Optimized?
The HD OPTI App automates thousands of performance-focused tweaks across Windows services, scheduled tasks, registry, power management, networking, memory usage, and more. Changes are safe, reversible, and applied in seconds—condensing years of research into a streamlined workflow.
Why These Gains Matter
Under demanding loads (multiplayer gaming, streaming, live production), background inefficiencies can trigger:
- Frame rate drops
- Audio pops/glitches
- Delayed mouse/keyboard input
- Encoding slowdowns
Reducing ISR/DPC overhead frees CPU time for the foreground app, while lower interrupt latency improves input feel and frame delivery. Fewer hard pagefaults also reduce disk activity and improve memory responsiveness.
Concluding Remarks
Targeted optimizations can materially improve Windows 11 responsiveness without a custom OS. Lower ISR/DPC service times and fewer pagefaults translate into more consistent, fluid behavior under load.
Important Context
This article focuses on OS-level latency, not guaranteed FPS gains. Real-world results vary by hardware, drivers, and app/game settings. Treat these as a benchmark of OS tuning rather than a universal performance promise.