Optimizing Windows 11 for Real-Time Performance
A detailed LatencyMon analysis of HD OPTI's effect on stock Windows and HDOS
Optimizing Windows 11 for Real-Time Performance: A LatencyMon Deep Dive
Published: June 2, 2025
🕒 4 min read
Modern Windows systems come with a wide array of background services, scheduled tasks, and telemetry processes designed to enhance user experience. However, these same features can become bottlenecks in real-time scenarios. This article explores how targeted OS-level optimization can improve performance using LatencyMon diagnostics.
Why LatencyMon?
LatencyMon is a diagnostics tool that evaluates a system's ability to handle real-time audio and task scheduling. It monitors kernel response times, driver behaviour, and memory faults - all of which can contribute to stutters, audio pops, or input lag. Whether you're a gamer or a content creator, reducing these latencies can lead to a smoother and more responsive experience.
The Testing Environment
Two Windows 11 configurations were tested using LatencyMon:
- Baseline: Default Windows install and HDOS install
- Optimized: Services and scheduling tuned with HD OPTI App
Each test was conducted over 15-minute runs under idle conditions, to ensure consistency and reliability while avoiding interference from active workloads.
Key Metrics Explained
- Average Interrupt-to-Process Latency: Measures how long it takes for the OS to respond to hardware events. High values can introduce input lag.
- Average DPC Latency: Tracks how long drivers take to complete deferred procedure calls. These are kernel-mode operations that must be handled quickly.
- Max ISR/DPC Times: Peak values that indicate how long a single driver or interrupt held up the CPU.
- Total Time in ISRs/DPCs: Indicates how much time your CPU spends servicing these calls. Higher values mean less time for apps.
- ISR/DPC Count: The total number of interrupts and deferred procedure calls processed during the test.
- Hard Pagefaults: Memory-related interruptions that force the OS to retrieve data from disk instead of RAM.
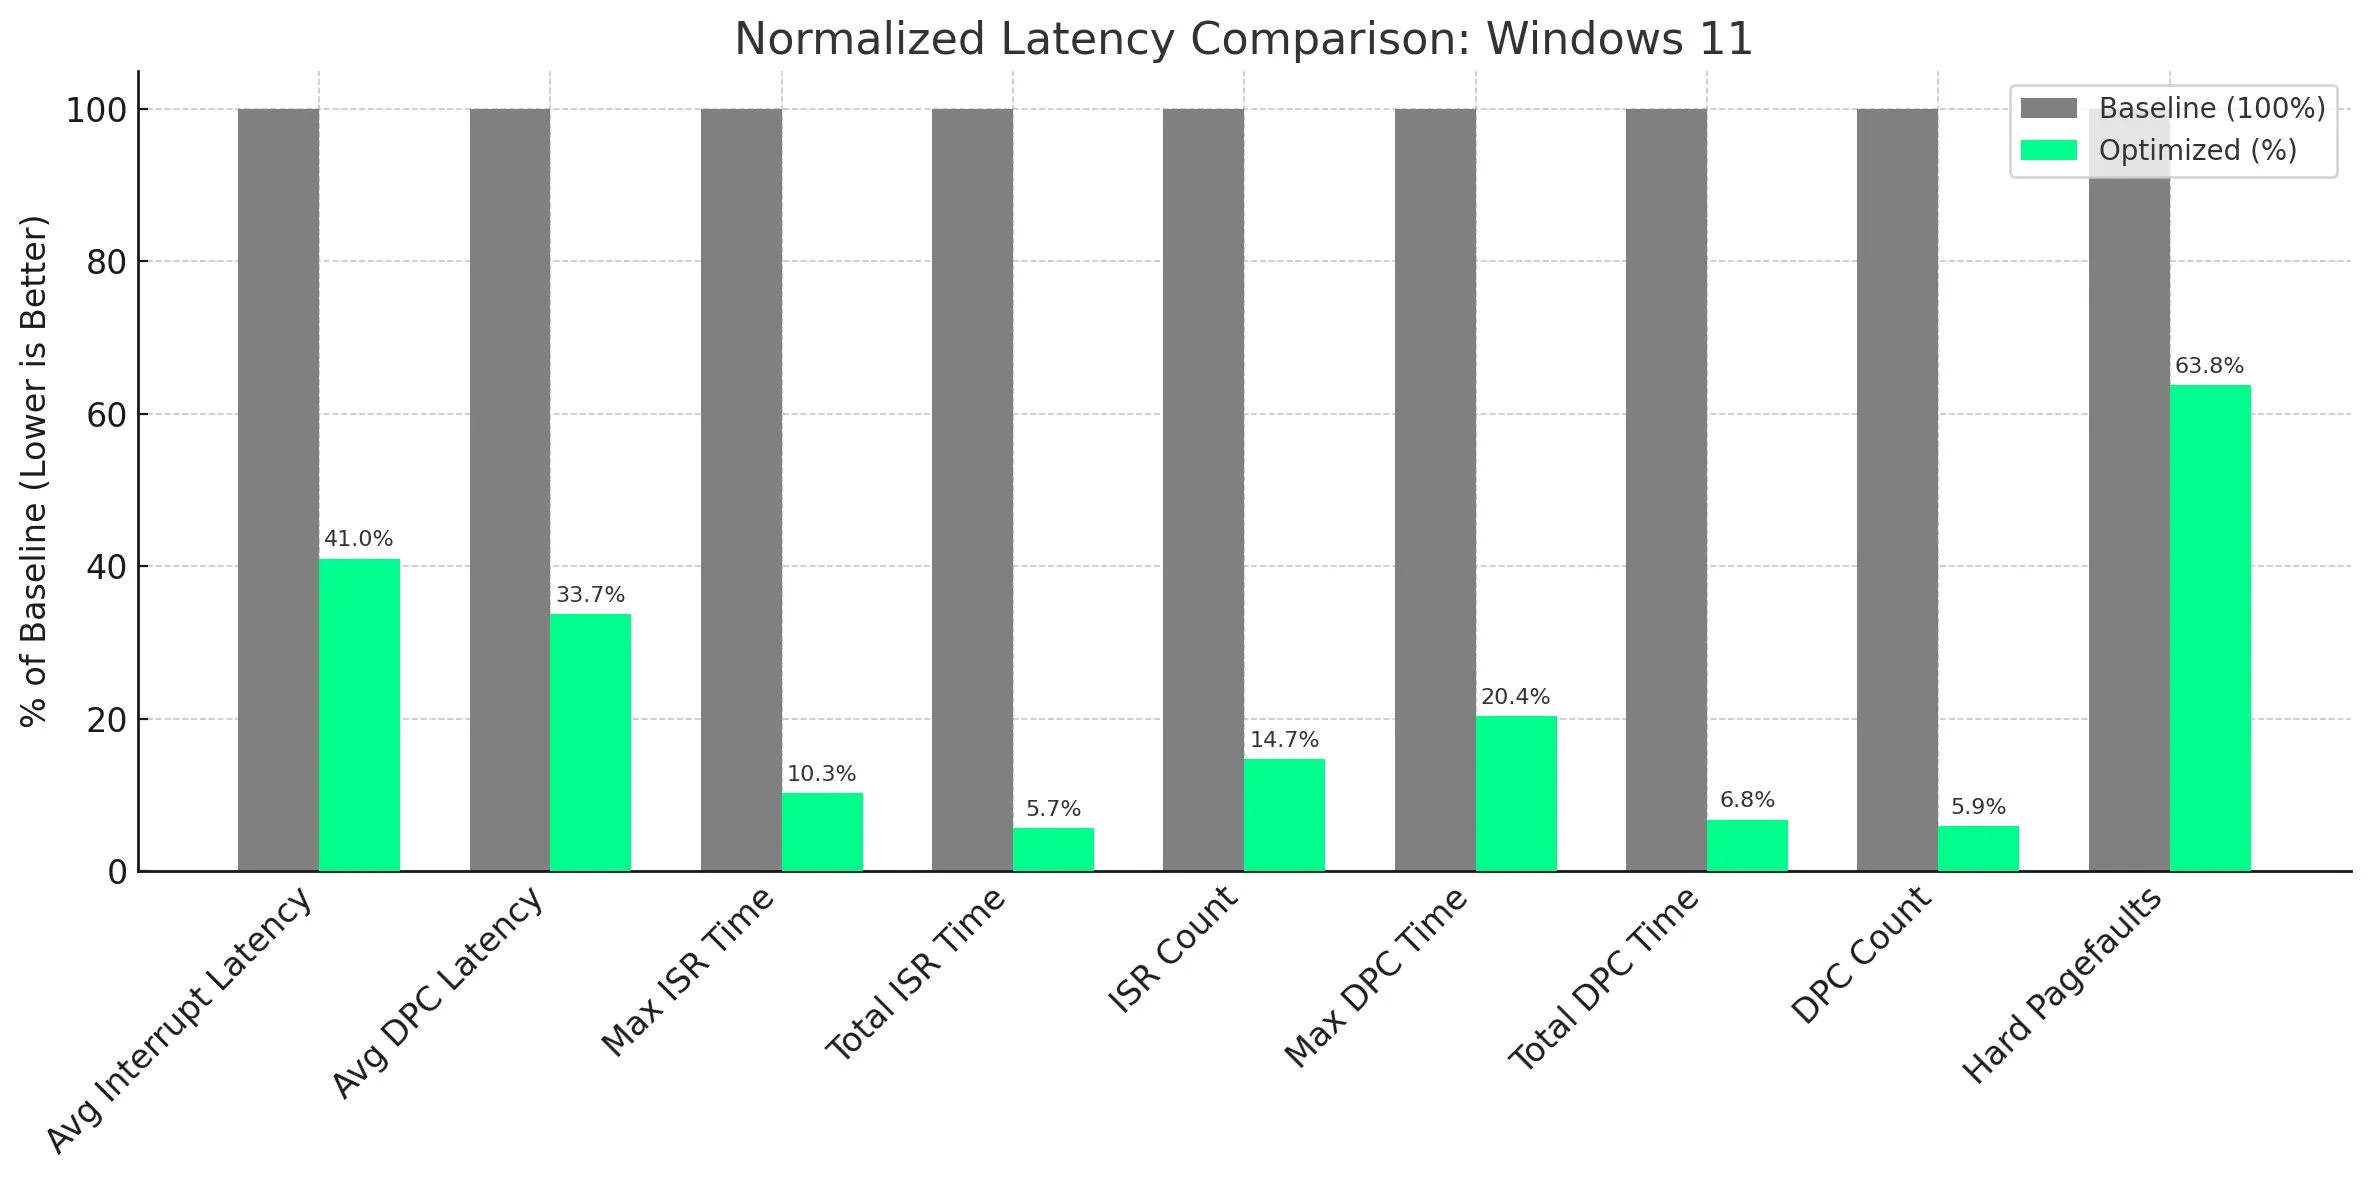
Base Windows: Before and After Optimization
Here are the raw LatencyMon readings comparing the baseline and optimized Windows 11 setup:
| Metric | Baseline | Optimized | % Improvement |
|---|---|---|---|
| Avg Interrupt Latency (µs) | 12.48 | 5.12 | 59.0% |
| Avg DPC Latency (µs) | 2.67 | 0.90 | 66.3% |
| Max ISR Time (µs) | 63.75 | 6.55 | 89.7% |
| Total ISR Time (%) | 0.000859 | 0.000049 | 94.3% |
| ISR Count | 191,666 | 28,167 | 85.3% |
| Max DPC Time (µs) | 567.76 | 115.65 | 79.6% |
| Total DPC Time (%) | 0.02610 | 0.001767 | 93.2% |
| DPC Count | 982,730 | 58,297 | 94.1% |
| Hard Pagefaults | 5,931 | 3,782 | 36.3% |
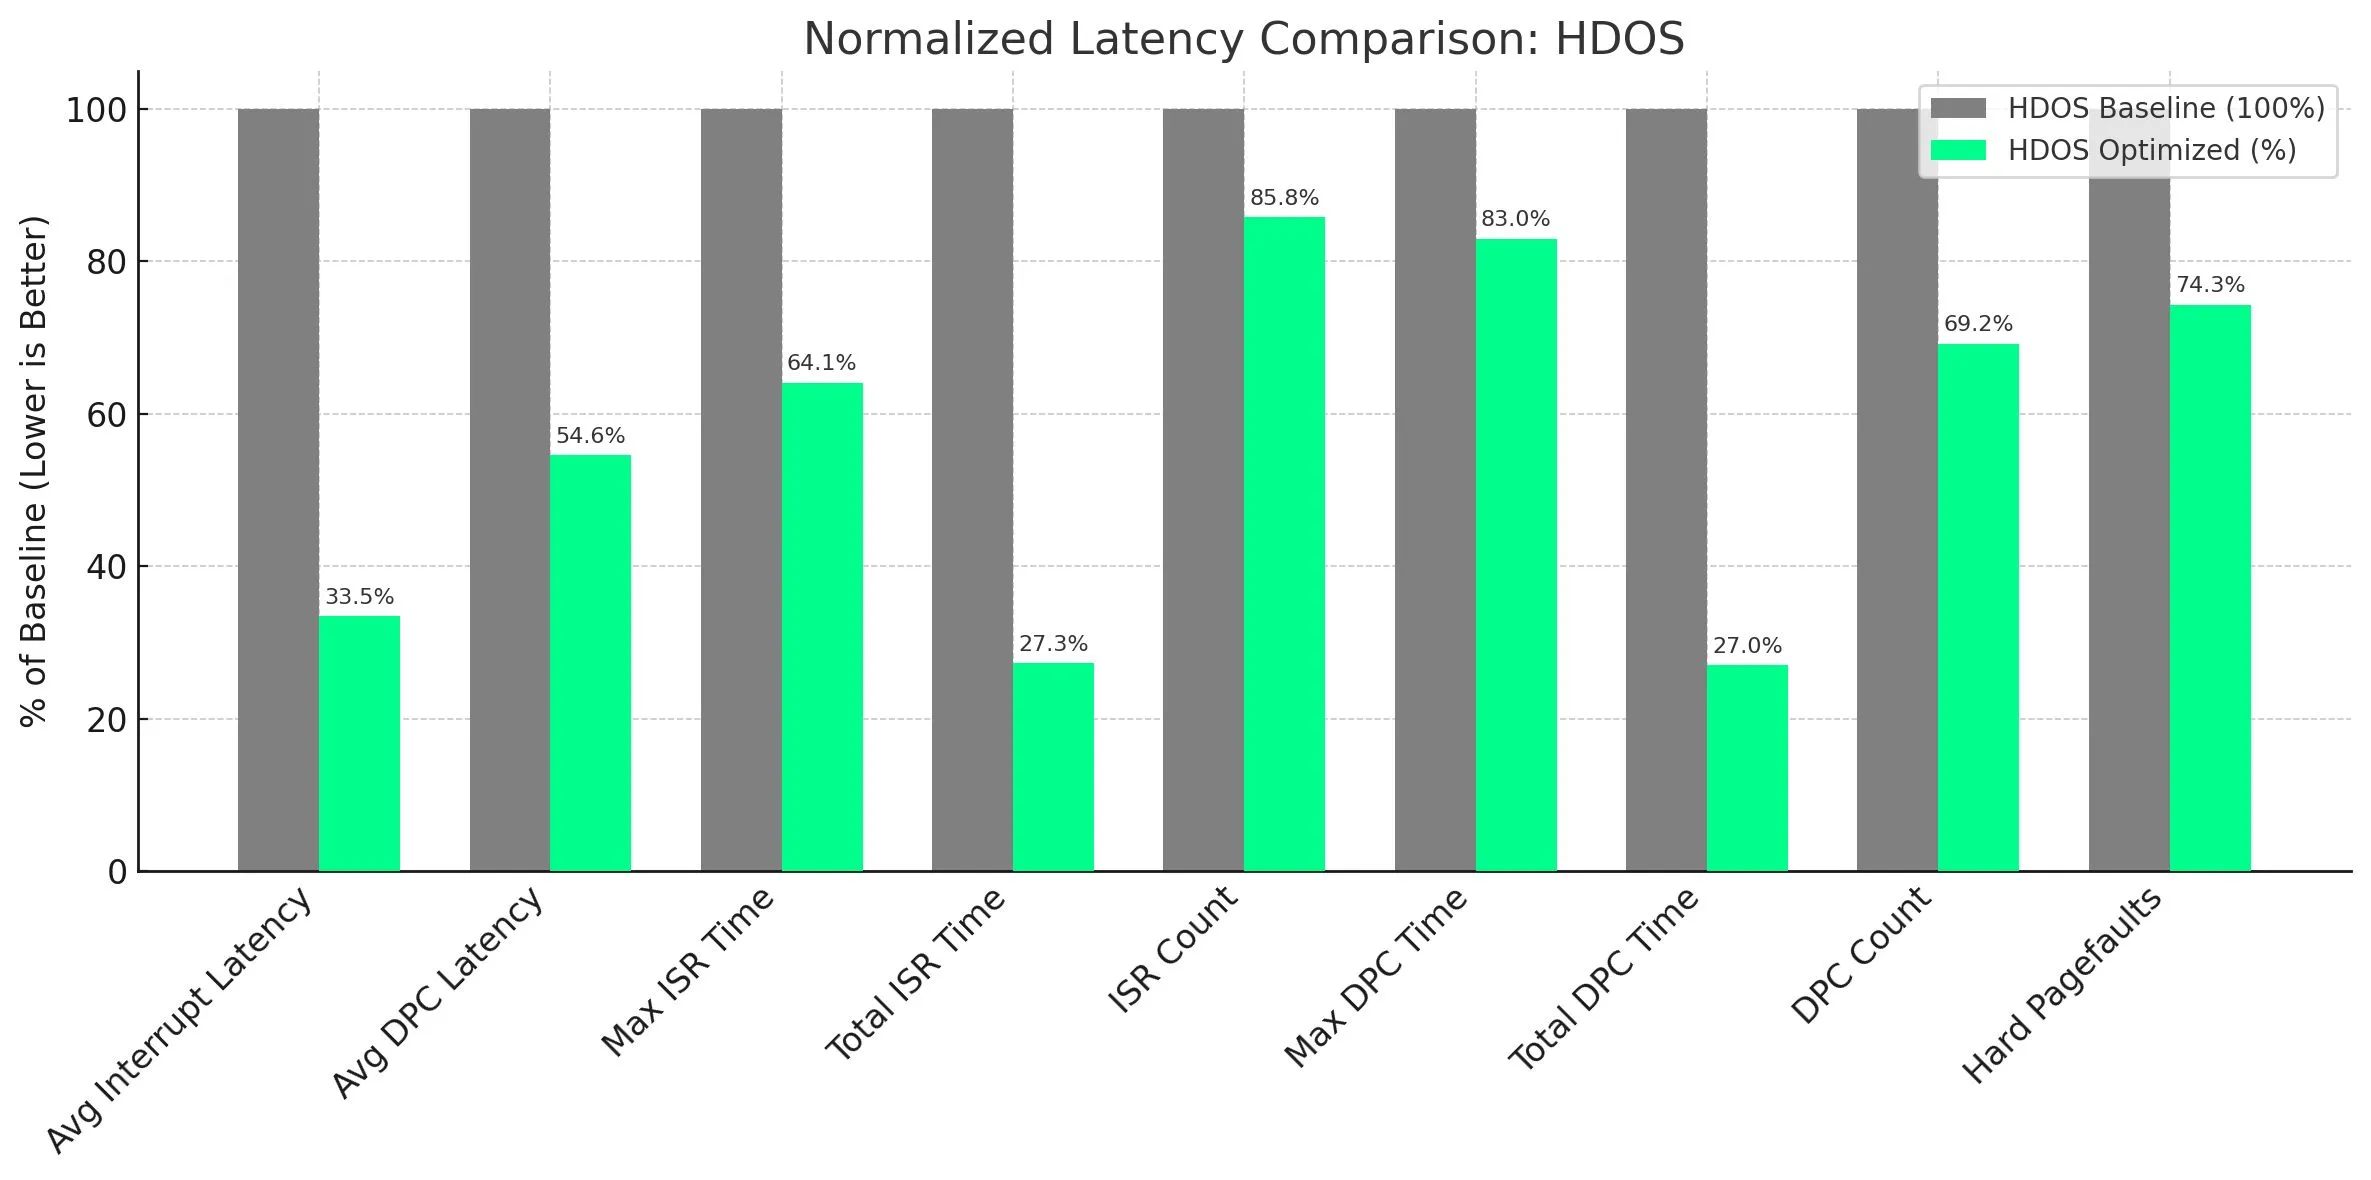
HDOS Optimization Comparison
To provide further context, we ran the same LatencyMon analysis on a stock HDOS build and its optimized version. The goal was to evaluate whether our optimizations yielded similar or even better improvements compared to Windows 11. Below is a breakdown of key LatencyMon metrics:
| Metric | HDOS Baseline | HDOS Optimized | % Improvement |
|---|---|---|---|
| Avg Interrupt Latency (µs) | 13.81 | 4.62 | 66.5% |
| Avg DPC Latency (µs) | 1.45 | 0.79 | 45.5% |
| Max ISR Time (µs) | 29.40 | 18.84 | 35.9% |
| Total ISR Time (%) | 0.000183 | 0.000050 | 72.7% |
| ISR Count | 33,476 | 28,719 | 14.2% |
| Max DPC Time (µs) | 154.52 | 128.21 | 17.0% |
| Total DPC Time (%) | 0.006464 | 0.001748 | 73.0% |
| DPC Count | 165,571 | 114,599 | 30.8% |
| Hard Pagefaults | 13,994 | 10,397 | 25.7% |
What Was Optimized?
The optimization process was carried out using the HD OPTI App, which automates the application of over 5,000 performance-focused tweaks. These include deep adjustments to Windows services, scheduled tasks, registry entries, power management, network configuration, memory usage, and more.
Instead of relying on manual toggles and scripts, HD OPTI bundles years of performance research into a streamlined utility that applies safe, reversible system-level changes in seconds. This allows users to focus on their tasks while benefiting from enhanced responsiveness, reduced latency, and overall system efficiency.
Why These Gains Matter
While the average user might not notice these improvements during everyday tasks like browsing or email, under demanding conditions such as multiplayer gaming or live streaming, background inefficiencies can cause:
- Frame rate drops
- Audio glitches or pops
- Delayed mouse or keyboard input
- Encoding slowdowns
Reducing ISR (Interrupt Service Routine) and DPC (Deferred Procedure Call) overhead frees up CPU cycles for your primary applications. Lower interrupt latency enhances input responsiveness and frame delivery, while minimizing hard pagefaults reduces disk activity and improves memory performance. Together, these changes lead to smoother system performance and better fluidity under heavy load.
Concluding Remarks
This experiment confirms that Windows 11 can be significantly improved with targeted optimizations, even without replacing it with a custom OS. The improvements in ISR/DPC handling and reduced pagefaults suggest real, measurable gains in system responsiveness and stability. If you're serious about gaming, content creation, or any task that benefits from real-time performance, taking the time to trim down Windows 11 can be well worth it. Stay tuned for our follow-up guide, which will walk you through every tweak applied to our optimized system.
Important Context: Scope of This Article
This article is focused entirely on Windows-level optimizations and their effect on system latency, as measured by LatencyMon. While improvements in system responsiveness and efficiency often lead to better real-world performance, including potentially higher FPS in games, such gains will vary widely depending on specific hardware configurations, drivers, and in-game settings. Therefore, readers should view these results as a benchmark for operating system tuning - not a guaranteed performance increase across all scenarios.